



At some point in most research projects, you'll need to assess whether a journal is credible, either to evaluate a paper you've found, to decide where to submit your own work, or to satisfy a supervisor or reviewer who wants to know the quality of your sources.
The problem is that journal ranking systems are genuinely confusing. Impact factor, SCImago Journal Rank (SJR), h-index, CiteScore, it’s more metrics than most researchers need, and they don't all tell the same story.
This guide explains what the main ranking systems actually measure, how to check them quickly, and importantly, where they fall short and what to look at instead.
Why journal rankings exist (and why they're confusing)
Journal ranking is in fact an entire field of study with emerging research and metrics being considered. It's an important area of research to make sure that the metrics being used are fair and authentic. These research efforts are focused on reducing biases that naturally exist in raw citation data, such as older journals having an unfair advantage, citing behaviors varying wildly between different research fields, the limitations of the proprietary databases (like Scopus or Web of Science) that calculate these scores, or certain databases missing non-English publications.
This guide focuses on the most common metrics used today, which include the journal impact factor, SJR, CiteScore, journal h-index, journal citation indicator (JCI), and source normalized impact per paper (SNIP). It is here to help you understand what each one is, which biases they attempt to solve, and which will work best for your research.
Impact factor: the most famous metric, and the most misapplied
The Journal Impact Factor (IF) is what most people mean when they say "journal ranking." It's calculated by Clarivate and published in the Journal Citation Reports (JCR) every year. The formula: citations received in a given year, divided by papers published in the previous two years. The result is an average citations-per-paper figure for that journal.
Simple enough. The problem is how people use it.
Impact factor is a journal-level average, not a paper-level quality score. A paper published in a journal with an IF of 12 might have zero citations. A paper in a journal with an IF of 2 might be the most-cited study in its subfield. The metric doesn't transfer down to individual papers the way researchers often assume it does.
The other problem: IF is not comparable across fields. A cardiology journal with an IF of 5 is doing well. A computer science journal with an IF of 5 is doing well. A mathematics journal with an IF of 5 would be extraordinary, because mathematicians cite less frequently, by convention. Comparing these numbers across disciplines is like comparing salaries without adjusting for cost of living.
How to check it: Your institution's JCR subscription is the primary route. If you don't have access, the journal's own website usually displays its IF prominently, any journal with a respectable one will tell you. Clarivate's Master Journal List at mjl.clarivate.com is free and at least tells you whether the journal is indexed in Web of Science.
When to use it: The Impact Factor is best used to evaluate and compare the overall prestige or popularity of journals within the same specific subject category . It is a highly practical tool for librarians who need to manage collections and make purchasing decisions, or for publishers assessing their market position against direct competitors . For researchers, the IF can provide a gross approximation of a journal's standing when deciding where to submit a manuscript, provided it is used alongside informed peer review rather than as a standalone measure of quality.
Scimago and Q1–Q4: the free option that most researchers should use first
Scimago Journal Rank (SJR), available free at scimagojr.com, is what most researchers should check first, not because it's more sophisticated than impact factor, but because it's free, it's fast, and the quartile system it produces (Q1–Q4) gives you something more interpretable than a raw number.
Here's how SJR works differently from impact factor: it weights citations by the prestige of the citing journal. A citation from Nature counts more than a citation from an obscure specialist journal. The logic is similar to how search engine ranking works, a link from a highly trusted site matters more than a link from a low-traffic blog.
Q1, Q2, Q3, Q4: what these actually mean
Within each subject category, Scimago sorts all journals by their SJR score and divides that list into four equal groups: Q1 is the highest ranked down to Q4 which are the bottom 25% in the category.

Three things most researchers don't realise about quartiles:
First, they're field-specific. Q1 in nursing and Q1 in physics are completely different things. You can only compare quartiles within the same subject category.
Second, a single journal usually appears in multiple subject categories with different quartile rankings in each. A journal might be Q1 in public health and Q2 in epidemiology. Always check the ranking for the category that matches your actual research, not the one that looks best.
Third, and this is the one that trips people up, quartile ranking is about the journal, not the paper. A Q1 journal can publish work of variable quality. A Q3 journal can publish something foundational. The quartile tells you about average citation impact across the whole journal's output. Nothing more.
How to check a journal's Scimago ranking (step by step):
- Go to scimagojr.com
- Type the journal name or ISSN in the search bar
- Click the journal from the results
- Look for the quartile ranking in your subject category, if multiple categories appear, pick the one closest to your field
- The profile also shows SJR score, h-index, and citation trend over time
That's genuinely all there is to it.
When to use it (the right first step): Because it is free, relies on the massive Scopus database (which covers more journals than Web of Science), and translates complex math into an easy-to-read Q1–Q4 system, SJR is the best starting point. Use it as your primary tool to quickly gauge a journal's reputation and field-specific standing when deciding where to submit your manuscript or deciding what to read.
CiteScore: Scopus's version, and why it's worth a look
CiteScore is Elsevier's metric for journals indexed in Scopus. It works like impact factor but with a four-year citation window instead of two, and it includes a broader range of publication types in its calculations.
The four-year window matters: it reduces the year-to-year volatility that can make impact factor feel arbitrary for smaller journals. A journal that had one excellent year won't spike and drop the way it might with a two-year window.
How to check it: Go to scopus.com/sources. Search by journal name or ISSN, no subscription needed for the metrics lookup. You'll see CiteScore, SJR, and SNIP all on the same profile page.
Being indexed in Scopus is itself worth noting as a quality signal. Scopus has inclusion criteria that most predatory journals can't meet, so if a journal appears there at all, it's passed at least one external filter.
Is 3.4 a good impact factor? What the numbers actually mean by field
This question comes up constantly, and the answer always depends on where you're doing your research.
Citation rates vary dramatically across disciplines, not because some fields do better science, but because of structural differences in how researchers publish and cite. High-volume fields with large communities, fast publication cycles, and strong incentives to cite generate much higher citation counts than small, methodical fields with long publication timelines.
Here's a rough guide to how impact factor ranges map to journal quality by field:
Medicine and clinical sciences: Top-tier journals (NEJM, The Lancet, JAMA) regularly exceed IF 50. Above 10 is excellent for most specialty journals. Above 5 is solid. Between 2 and 5 is respectable for a specialist publication. Below 2 is modest.
Life sciences and biology: Above 10 is strong. Top journals in cell biology and genetics push into the 30–50 range. Most good specialty journals sit between 3 and 10.
Natural sciences (chemistry, physics): Above 5 is strong for most areas. High-prestige physics journals sometimes have surprisingly modest IFs — physics has lower citation rates than biology, and some historically important journals predate the metric entirely.
Social sciences and psychology: Above 5 is excellent. Between 2 and 4 is a respectable range for well-regarded journals. Many journals that researchers consider top-tier in their subfield have IFs below 3.
Engineering: Highly variable. Between 2 and 6 covers most well-regarded engineering journals. Areas like AI, renewable energy, and biomedical engineering have seen rapid IF inflation recently.
Humanities: IF is largely irrelevant here. Citation rates are structurally low, and most well-regarded humanities journals have IFs below 1 or aren't indexed in JCR at all. Field-specific lists like ERIH PLUS are more appropriate than citation-based metrics.
So: is 3.4 a good impact factor? For a social science or engineering journal, yes, it's solid. For clinical medicine, it's modest. For a humanities journal, it would be unusually high. The number needs context.
When to use it: CiteScore is an excellent tool when you want a more stable, less volatile assessment of a journal's recent impact, thanks to its robust four-year citation window. It is also the ideal metric to check when you are evaluating newer journals, open-access titles, or journals in niche fields. Because Scopus indexes a significantly larger number of publications than Web of Science, many well-regarded specialist journals will have a CiteScore even if they do not have an official impact factor.
Citation counts have similar field-dependency issues, see what is a good citation count for a research paper for field-by-field benchmarks.
Free tools you can use without an institutional subscription
Most researchers assume journal ranking data requires expensive database access. Most of it doesn't.

Scimago (scimagojr.com): Free, no login. Quartile rankings, SJR scores, h-index, and citation trends for all Scopus-indexed journals. Start here.
Scopus Sources (scopus.com/sources): Free to search. CiteScore, SJR, and SNIP for Scopus-indexed journals. Good cross-check if Scimago's result surprises you.
Clarivate Master Journal List (mjl.clarivate.com): Free to search. Tells you whether a journal is indexed in Web of Science. Full JCR impact factor data requires a subscription, but the indexing check alone is useful.
DOAJ (doaj.org): For open access journals. DOAJ listing means the journal has been evaluated against quality criteria independently of citation metrics. Worth checking if you're unsure about an OA journal.
ERIH PLUS (kanalregister.hkdir.no/publiseringskanaler/erihplus): Specifically for humanities and social sciences. More appropriate for these fields than citation-based metrics, which structurally disadvantage low-citation disciplines.
Google Scholar Metrics (scholar.google.com/intl/en/scholar/metrics.html): h5-index by broad category. Less precise than Scimago, but useful for a quick orientation when you don't know a field at all.
When to be critical of the system
Knowing how to use these tools is one thing. Knowing where not to trust them is equally important.
Review articles inflate impact factor. A journal that publishes mostly reviews will have a higher IF than a comparable journal publishing mostly original research, because reviews get cited more, by more people, for longer. The two journals might be equally rigorous in their editorial standards. The metric doesn't tell you that.
New journals are structurally penalised. A journal founded last year has had no time to accumulate citations. An excellent new journal can easily have no quartile ranking at all, not because it's low quality, but because the metric hasn't had time to develop. Some of the most exciting specialist journals in emerging areas sit unranked for years.
Rankings measure the journal, not the paper. This bears repeating because researchers forget it constantly. The quartile tells you about average performance across the journal's entire output. A single paper inside that journal needs its own evaluation, for methodology, relevance, and how it sits in the broader literature. A Q3 journal might have published exactly the foundational paper your review needs.
Cross-field comparisons are meaningless. A Q1 ranking in medieval studies and a Q1 ranking in oncology cannot be compared. They only mean "top 25% within this specific category."
What about author metrics like h-index?
While the metrics above evaluate the journal, you will often see metrics attached to individual researchers. The most common is the h-index, which measures a scholar's lifetime productivity and citation influence. An author with an h-index of 20 has published at least 20 papers that have each been cited 20 or more times.
The limitation: Just like journal metrics, the h-index has blind spots. Because it accumulates over a lifetime, it heavily favors older researchers and cannot decrease, meaning it doesn't reflect a researcher's current impact. It also credits all co-authors equally, which can be misleading in fields where massive collaborative papers are common. Use the h-index to gauge an author's historical track record, but evaluate their recent papers individually.
What rankings can't tell you, and what actually can
Here's the limitation none of these tools can solve: they measure a journal's global average citation impact. They can't tell you whether a journal is relevant to your specific research question.
The most useful signal for that isn't Scimago. It's whether a journal appears repeatedly in the citation network around your topic. A citation network simply shows how papers connect to each other through references and citations. Instead of looking at a journal's overall prestige, you're looking at which papers, authors, and journals researchers in your topic area consistently build on.
When you're building a literature map in ResearchRabbit and notice that papers from a particular journal keep appearing across your seed papers' reference lists, that journal is publishing work your field actually builds on, regardless of its quartile. To check this directly, select References for any seed paper in ResearchRabbit and scan which journals appear most frequently across your results. A journal can be Q2 globally and absolutely central to your specific subfield. Citation networks make these relationships much easier to see than any ranking system can.
This doesn't replace checking Scimago, that's still a fast and useful credibility check. But if you find yourself relying heavily on quartile rankings to decide which papers are worth reading, you're using a journal-level tool to make a paper-level decision. It's the wrong tool for that job.
For more on evaluating paper quality beyond journal rankings, see our guide to how to find high-quality research papers.
The practical ranking check: a 3-step workflow
When you need to quickly assess a journal and don't want to spend more than a few minutes on it, here's a workflow that covers the essentials.
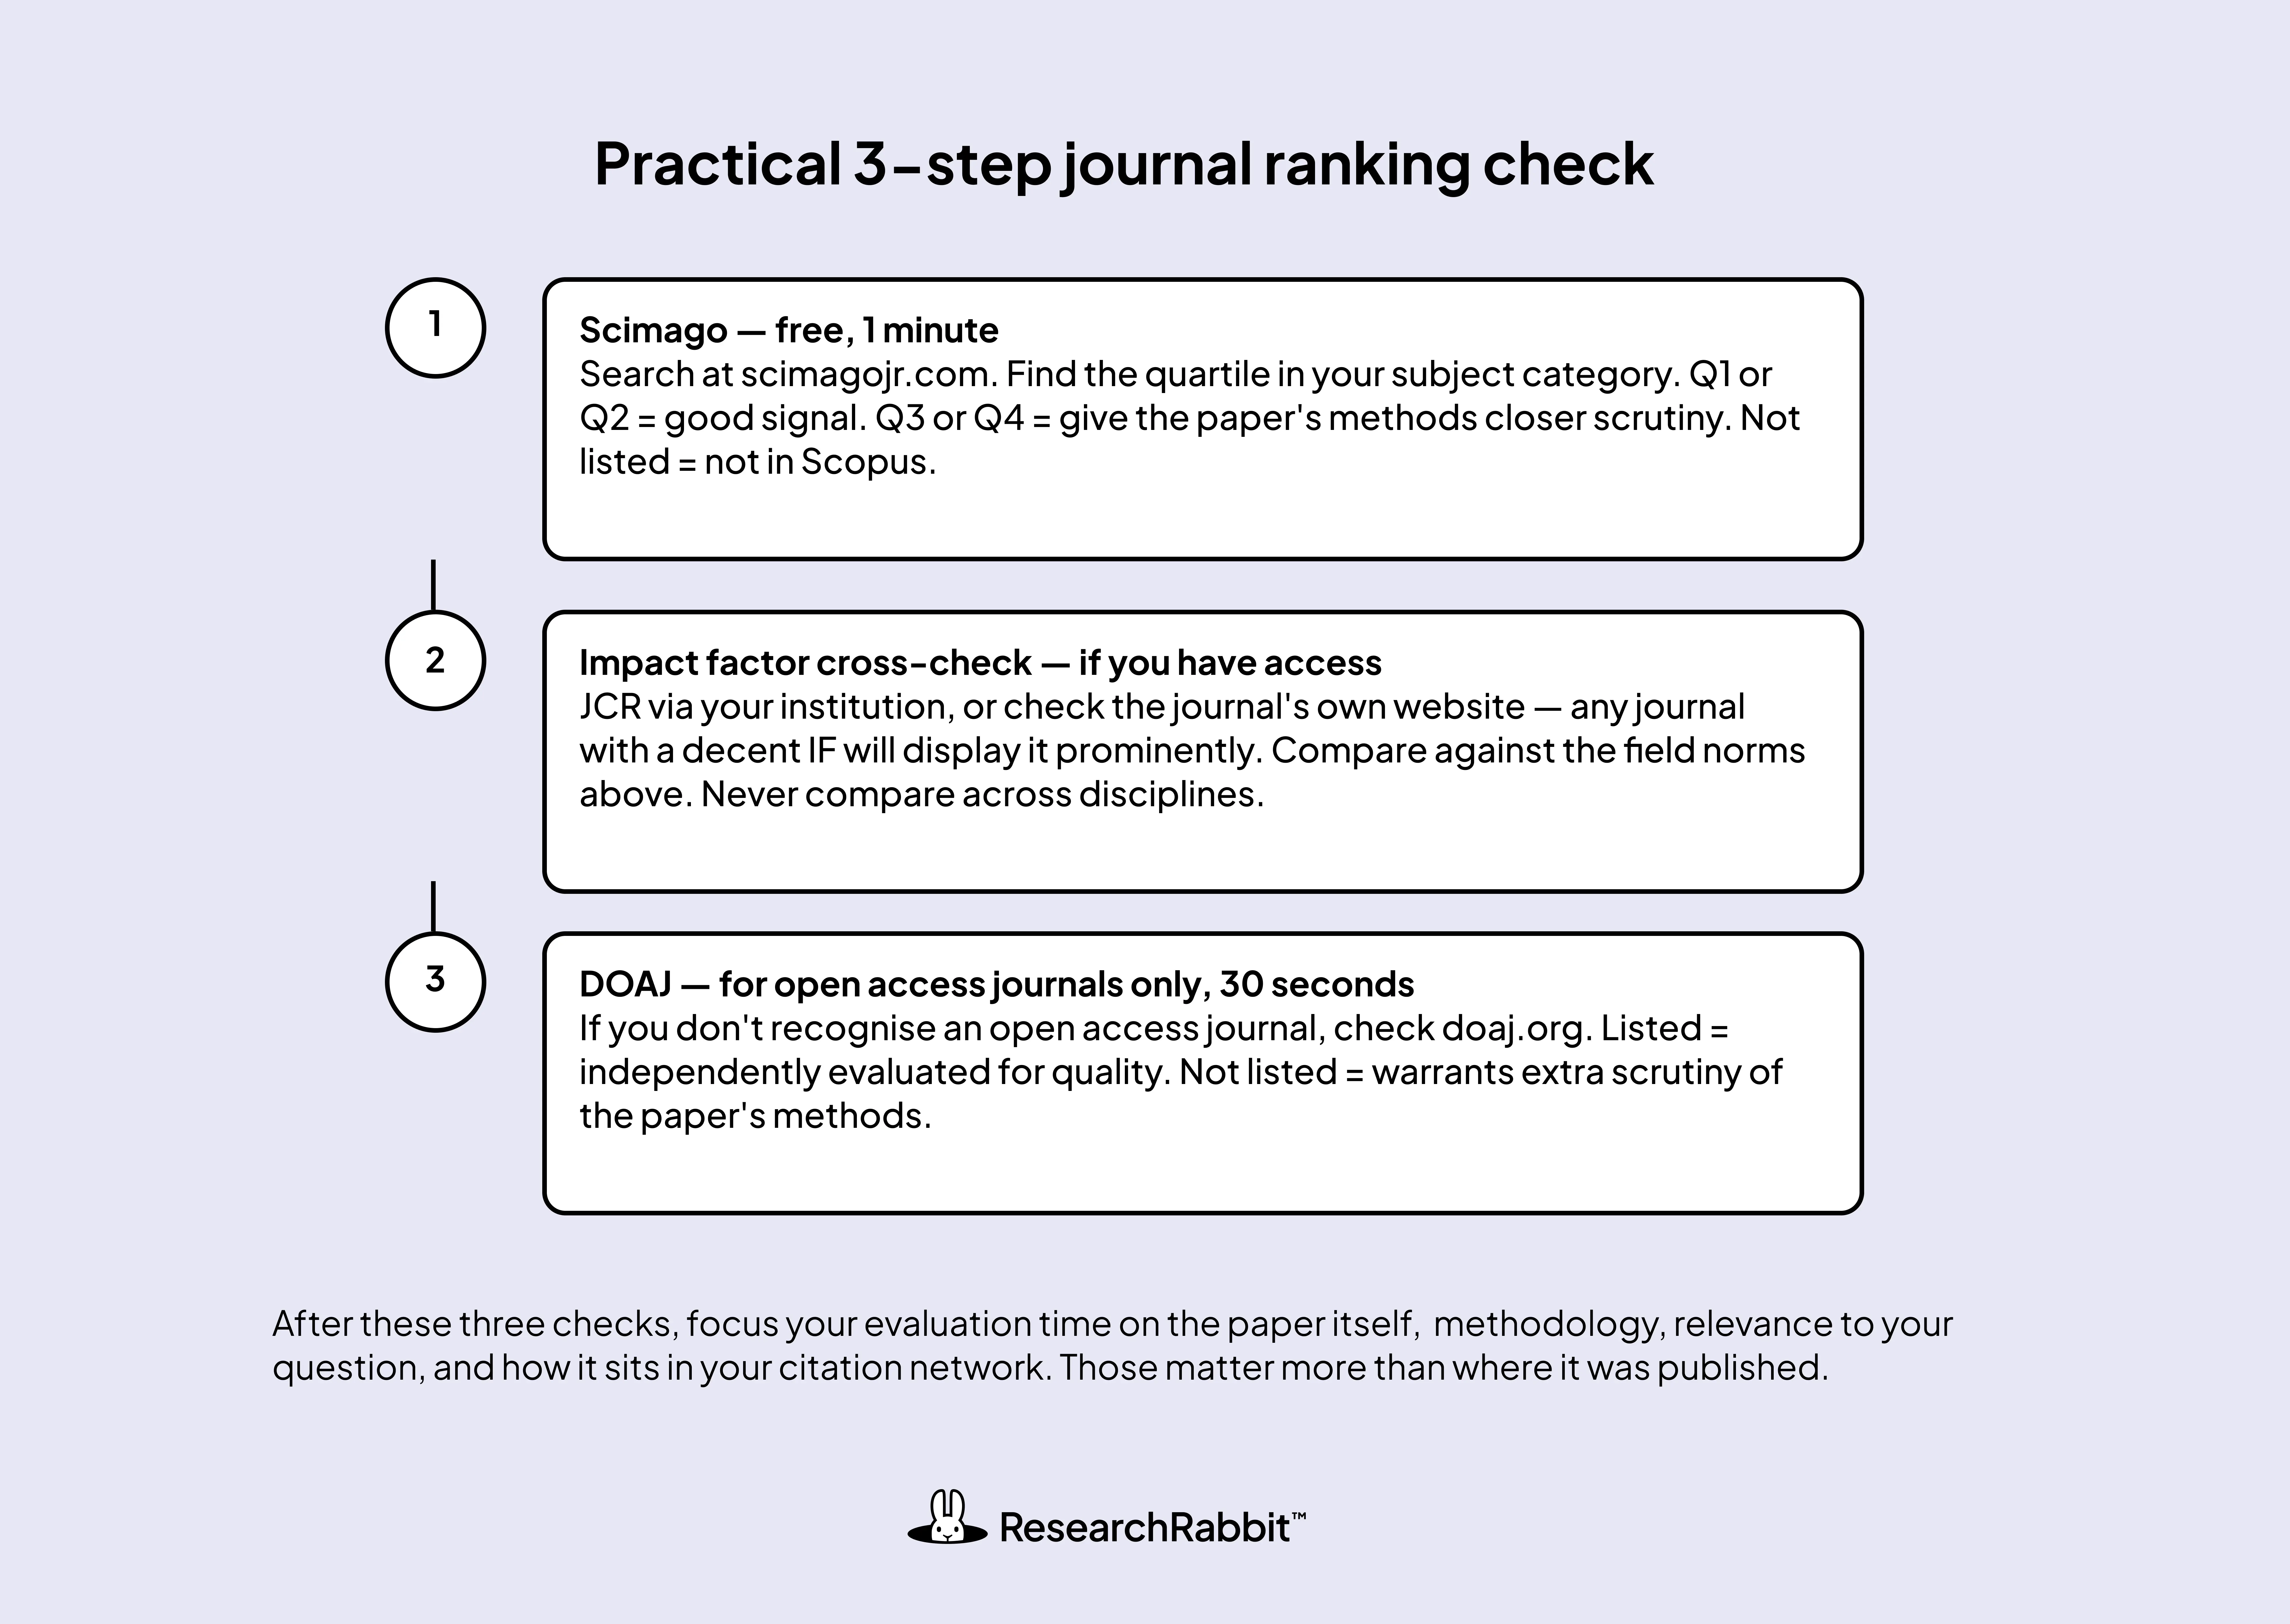
Step 1: Scimago (free, 1 minute) Search the journal at scimagojr.com. Look for its quartile in your subject category. Q1 or Q2 is a good signal. Q3 or Q4 means the paper itself deserves a closer look before you rely heavily on it. Not listed means it's not in Scopus, which doesn't make it predatory but reduces external validation.
Step 2: Impact factor or H-Index cross-check, free and paid options If you have JCR access through your institution, check the IF and compare it against the field norms above. If you don't have institutional access, H-Index is a freely available alternative, search the journal on Scimago and it's listed right alongside the quartile ranking. Both measure journal influence in different ways; neither should be compared across disciplines.
Step 3: DOAJ (for open access journals only, 30 seconds) If the journal is open access and you don't recognise it, check whether it's listed in DOAJ. Listing means it has been evaluated against quality criteria independently of citation metrics.
After these three checks, focus your remaining evaluation time on the paper itself, not the journal. Method quality, relevance to your question, and position in your citation network are ultimately more important than where it was published.
💡 Running a large-scale review?
If you're working through hundreds of papers, checking journal quality one by one adds up. ResearchRabbit+ lets you set SJR quartile and H-Index thresholds directly in the search filter, so only papers from journals that meet your quality bar appear in your results. What takes three manual checks per paper becomes a single upfront setting.
%20(800%20x%201036%20px).webp)


This is a big test comment on your article.